Download & Send Reports in the Audio Analytics Dashboard
Vydia’s Audio Analytics Dashboard makes it easy for you to see granular audio streaming data. You can evaluate the overall growth of your released content and collect insights to share with your team. Filter your search, export the CSV file, and send to your contributors. Let’s take a look!
HOW TO GET THERE
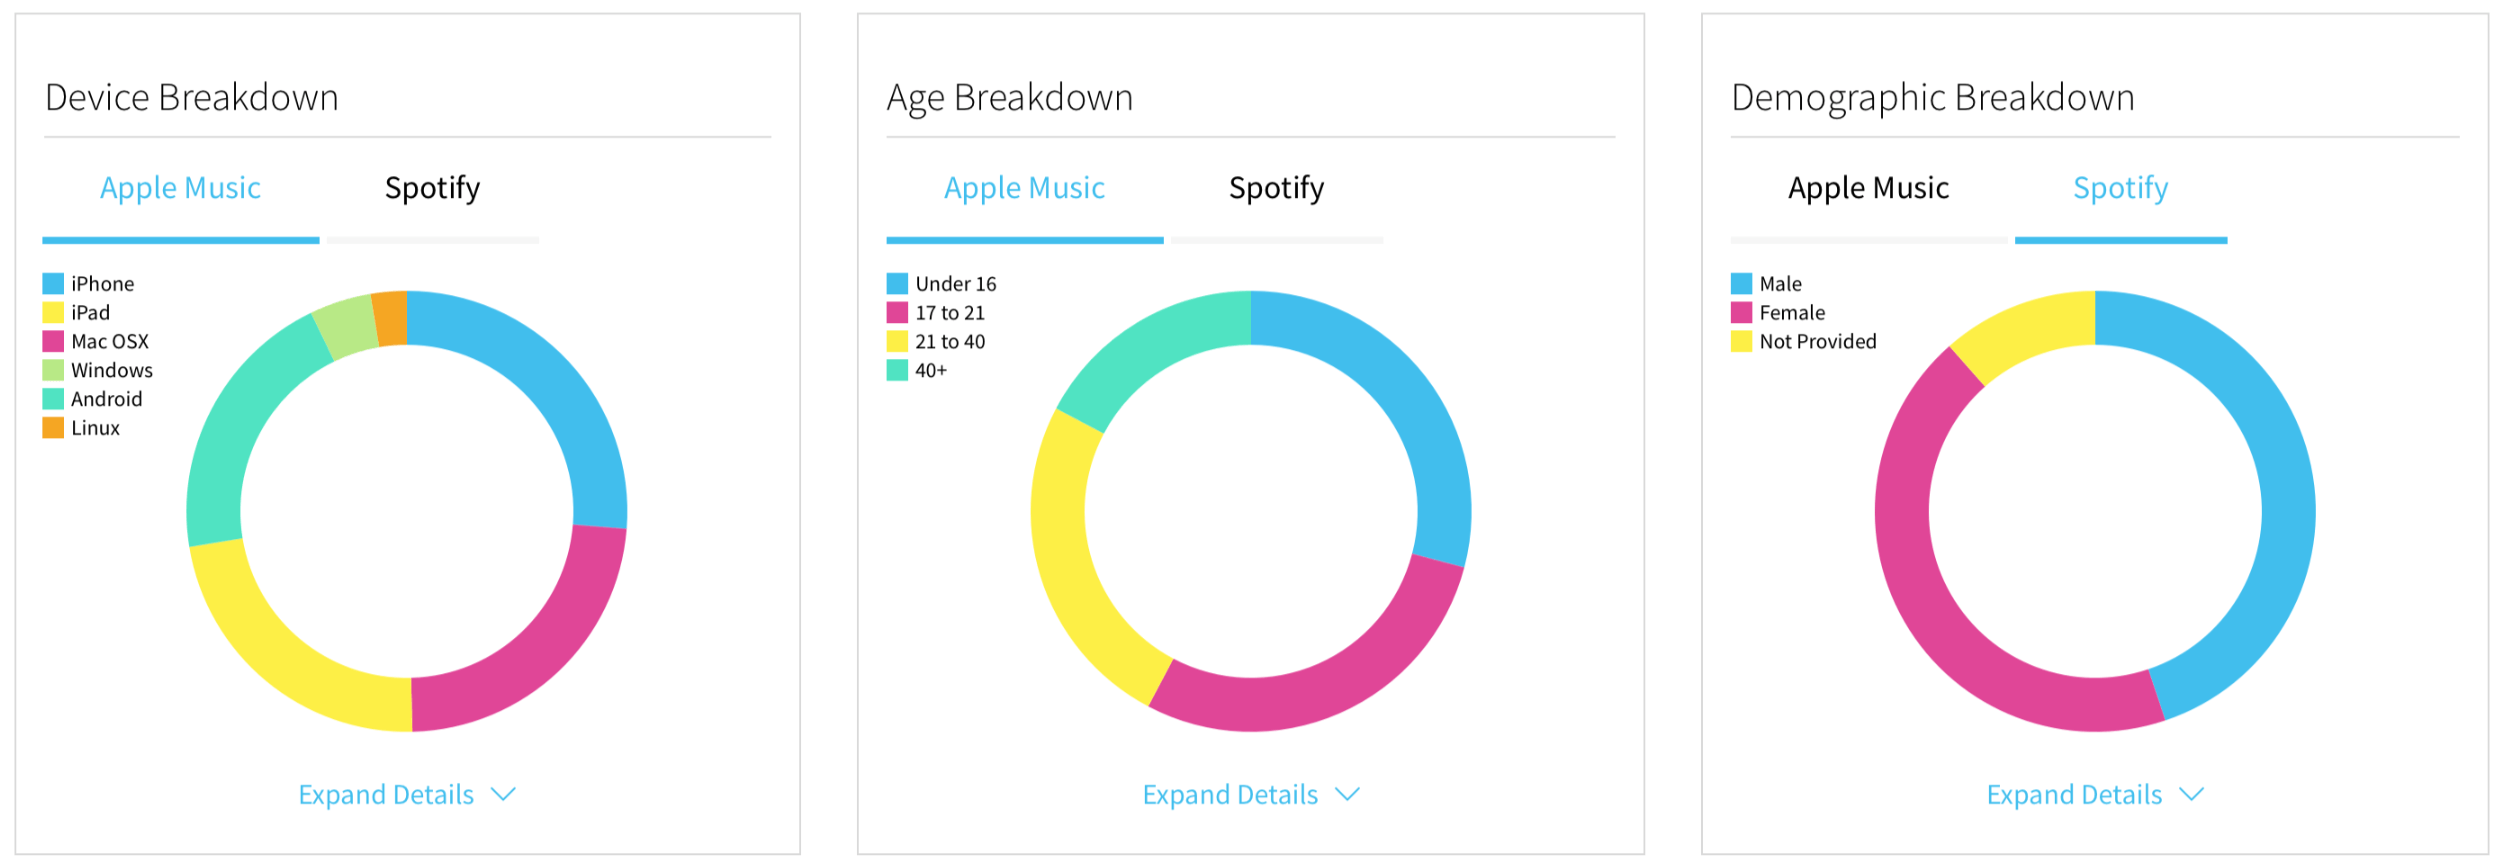
After logging in to the Vydia dashboard, navigate to Insights and click Audio Analytics. Label admins are able to filter down to the user, creator, or content-level while individual users will only be able to filter their content. After adding the filters, you can further narrow down the data by selecting a date range. No need to view lifetime streaming data when you’re only interested in seeing last week’s! Click ‘Lifetime’ and select either the last 7, 14, or 30 days to see performance data within that range. You’ll then be able to see your Top Content on Apple and Spotify as well as a list of the Top Countries streaming your music. For more insights, scroll down to see Device, Age, and Demographic breakdowns. These graphs help you understand what your target fanbase looks like – their age, gender, and what device they use to stream your music.
Don’t stop there! Stream Sources show where your Apple Music and Spotify streams came from. Whether it was from another playlist, a radio station, or just by manually searching, you will be able to evaluate where listeners find your content. Spotify Skips & Saves determine how many skips your content received and how many were saved to a user’s collection over a period of time. You may even search by geographic region. Last but not least, at the bottom of the Audio Analytics Dashboard, you will find iTunes Downloads. This data is categorized by Top Content, Top Countries, Age & Gender Breakdown. On the label level, an admin will also be able to view Top Clients and Top Creators.
DOWNLOAD AND SEND REPORTS
Users can now download and send reports to various stakeholders with the new Downloadable Reports feature. Once in the Audio Analytics dashboard, filter your search and select a date range. Then, you will be able to export the CSV file to see categorized performance data. This information will be useful for the artist’s team to see how their marketing efforts are impacting listenership. It will also help adjust their release strategy to target the right audiences.
Our Audio Analytics dashboard is the place where labels receive a high-level understanding of how well their content is performing. The ability to export and share one file with all the critical data is simple, efficient, and guaranteed to influence your next move.